A performance breakthrough on small file transfers
(Codename: LOWTIDE)
While testing Nitrogen, the protocol within Caffeine, using small files (<2mb) we discovered peculiar behavior that soon launched an investigation and a subsequent performance breakthrough.
Internally, we had conflict. One team thought that Caffeine was going as fast as it could, and another team wasn’t convinced and thought we had found a performance bug. In the end, a real performance bug did exist. As a result today, small file transfers move even faster than before through Caffeine.
This entry details the discovery of this interesting and exciting performance bug.
Peculiar Behavior
For response sizes less than 200kb (with <5ms backend latency), we knew that Caffeine is roughly 1.5x-2x the ping time for the equivalent network conditions and client-server distance. While evaluating the performance effects of physical distance between client and server, requests of size 200kb-400kb were taking 2-4x the ping time.
- Was Caffeine just not as fast on medium-sized file transfers?
- What could explain this performance degradation?
A Closer Look
We pulled out our lab tools and started looking into how we degrade over small requests. And the answer is: we didn’t. Or at least, not according to the tools. Here’s what those experiments looked like:
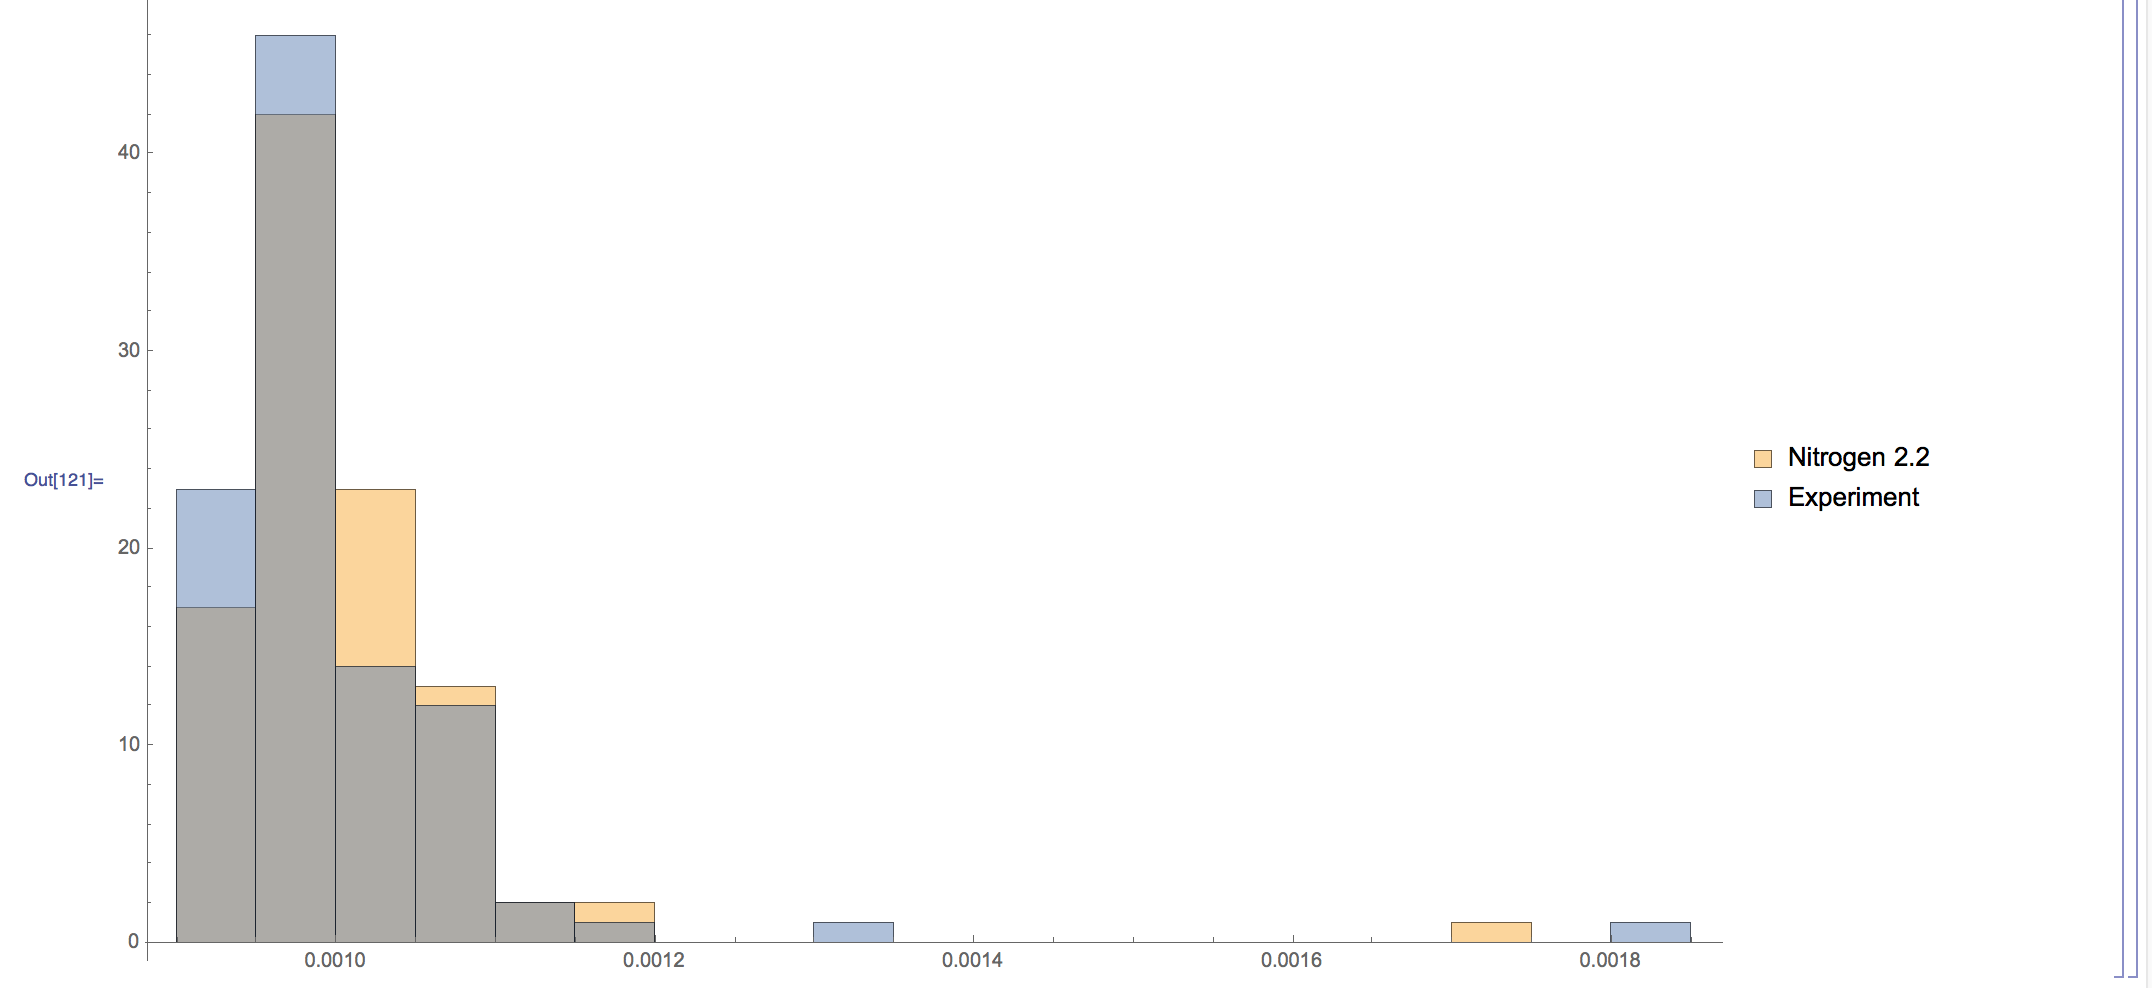
What is seen here is… nothing. These two populations behave the same. None of the experiments we ran would show changes in performance for response size ranges between 200kb-400kb. Perhaps for response sizes that are MUCH larger, as in “may not fit in your RAM” large, we can show something. But that wouldn’t be seen here; that’s not the problem we think may exist for <400kb.
…so we started wondering about our tooling.
An Even Closer Look
We put together sample Mac apps that closely replicated the same kind of requests we were making earlier.
Client source code:
import Cocoa
import Nitrogen

let parameterAddress = "10.0.1.2"
let parameterPort: UInt16 = 56663

let badBytes = [UInt8](count: 800, repeatedValue: 0)

class ViewController: NSViewController {

    override func viewDidLoad() {
        super.viewDidLoad()

        let keyPath = NSBundle.mainBundle().pathForResource("insecureMIDKey", ofType: "key")!
        try! NSFileManager.defaultManager().setAttributes([NSFilePosixPermissions: NSNumber(short: 0o0600)], ofItemAtPath: keyPath)
        let secretKey = try! N₂.SecretKey(readFromFile: keyPath)
        let c = try! N₂.Client(address:Address(printableAddress: parameterAddress, port: parameterPort) , clientLongTermKey: N₂.SecretKey(), serverLongTermKey: secretKey.publicKey)
        try! c.authenticate()

        for _ in 0..<100 {
            let start = NSDate()
            try! c.performRequest(badBytes)
            let end = NSDate()
            print(end.timeIntervalSinceDate(start))
        }
    }
}
Server source code:
import Cocoa
import Nitrogen
import NaOH

let badBytes = [UInt8](count: 35000, repeatedValue: 0)


class RD : N₂RequestDelegate {
    func handleRequest(request: ArraySlice<UInt8>) throws -> [UInt8] {
        return badBytes
    }
}

class ViewController: NSViewController {


    override func viewDidLoad() {
        super.viewDidLoad()
        let keyPath = NSBundle.mainBundle().pathForResource("insecureMIDKey", ofType: "key")!
        try! NSFileManager.defaultManager().setAttributes([NSFilePosixPermissions: NSNumber(short: 0o0600)], ofItemAtPath: keyPath)
        let secretKey = try! N₂.SecretKey(readFromFile: keyPath)
        let s = try! N₂.Server(address: Address(printableAddress: "0.0.0.0", port: 0), serverLongTermKey: secretKey)
        print(s.boundAddress)
        let stream = try! s.accept(RD())
        try! stream.authenticate()
        while true {
            try! stream.handleOneRequest()
        }
    }
}
Then we would measure time across Nitrogen as seen from the client, played with different request sizes, tweaked some internal values inside Nitrogen, and looked for straws to grasp. Still nothing. Graph after graph after graph, identical populations:
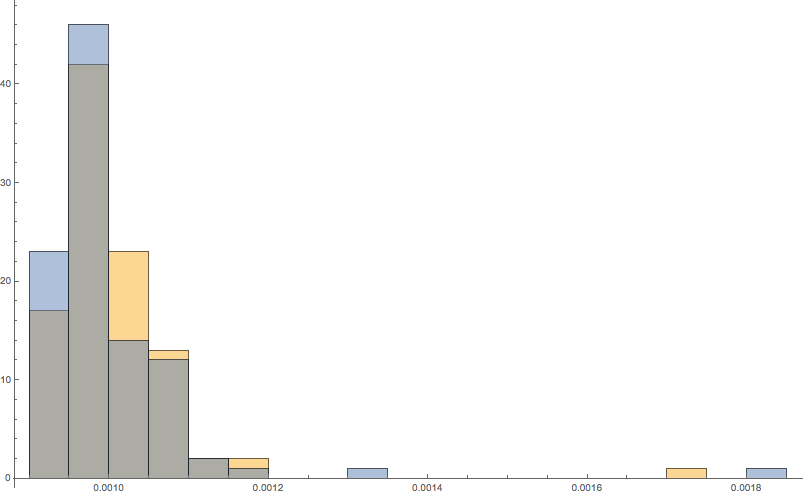
So we started thinking more critically. We have a wireshark trace (not shown) and we have strong reason to believe this is a bug. Why can we reproduce in one place and not here? What is different? We have two apps. The request sizes are the same. What is so different about the first environment so that it can produce the bug?
Through hours of trial and much error…
- The actual speedbump was inside the kernel.
- Because of the special, kernely nature of this bug, it was ONLY reproducible on two machines.
- NOT in-process
- NOT between two applications on the same computer
- NOT between mac and simulator
- NOT from one computer, out via wifi, to a router, back via eithernet, to the same computer
- NOT between e.g. Linux and OSX VMs on the same machine
- ONLY between two ACTUALLY distinct HARDWARE devices. Like, unless you have TWO POWER BUTTONS, you will not see this behavior.
- Our CI setup, as it turned out, was not configured to test that. To the extent that we test this scenario outside CI, we expect additional network latency anyway, and we just “sort of assume” the extra latency we see is legitimate.
- Spoiler alert: it’s not.
When we started testing honest-to-god multi-device setups in the lab, we got our first result.
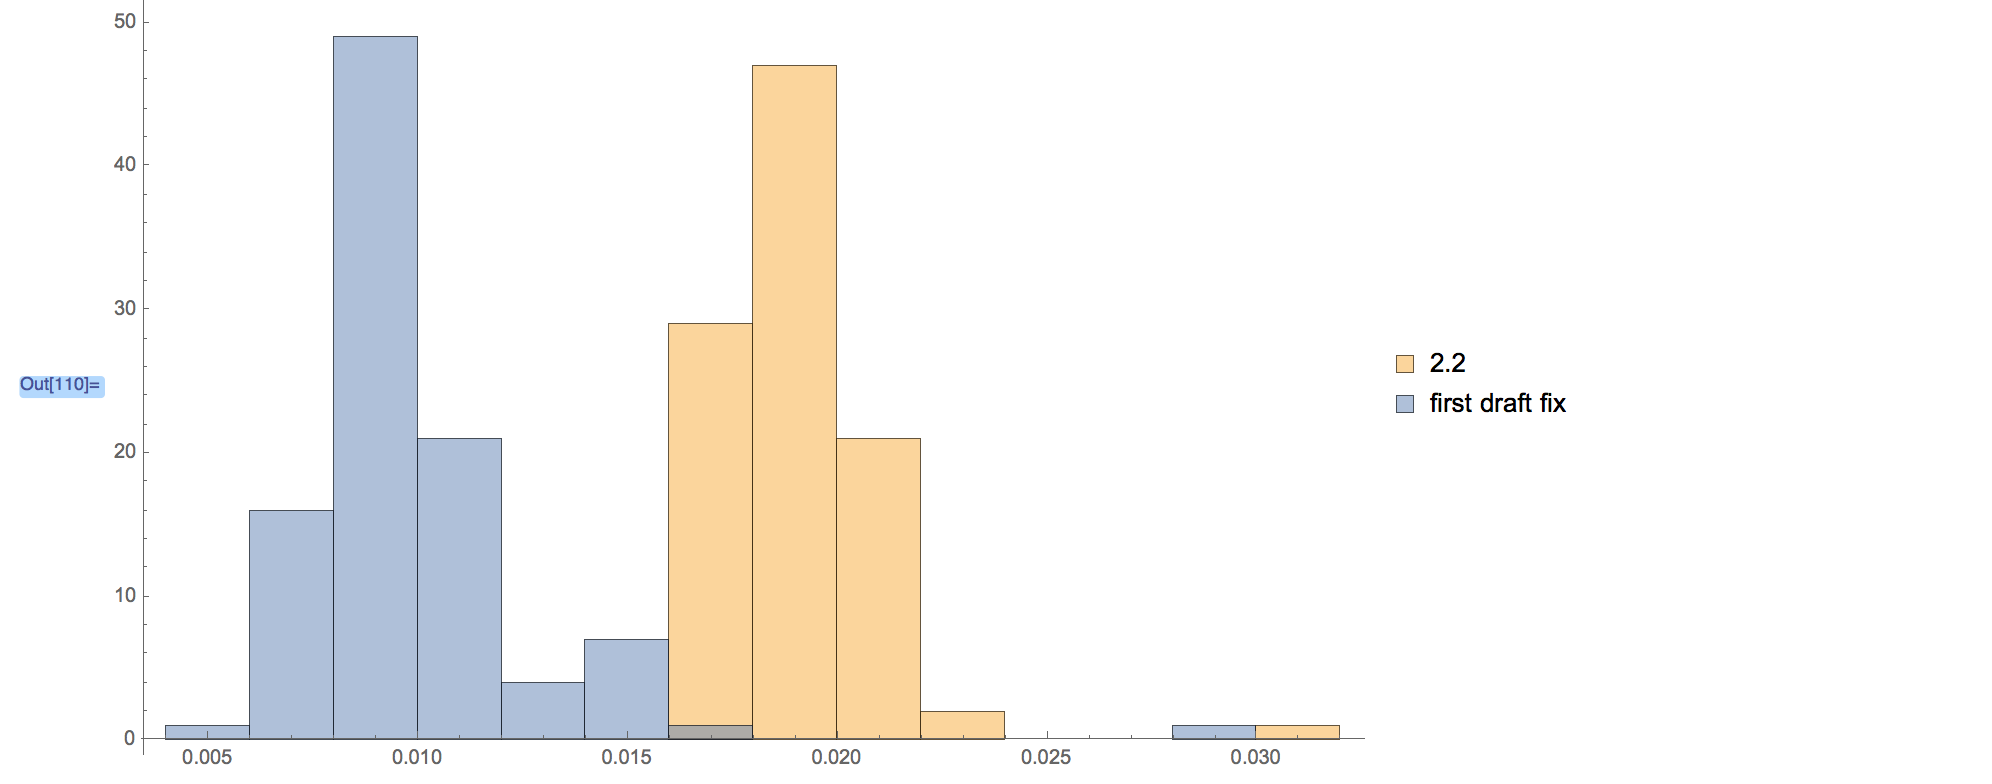
Aha! One doesn’t need a p-value to know that’s significant! They barely even touch!
That’s just the first draft. It’s a 2x performance improvement on the sample apps shown above.
After we knew what lever controlled this problem, we were able to go back into our tooling and calculate all new parameters that optimize this case, and then feed back into our performance model. A little supercomputing (thank you Amazon) time later, tweak a bunch of data tables, recompile, and hold onto your seat, because this is an amazing graph…
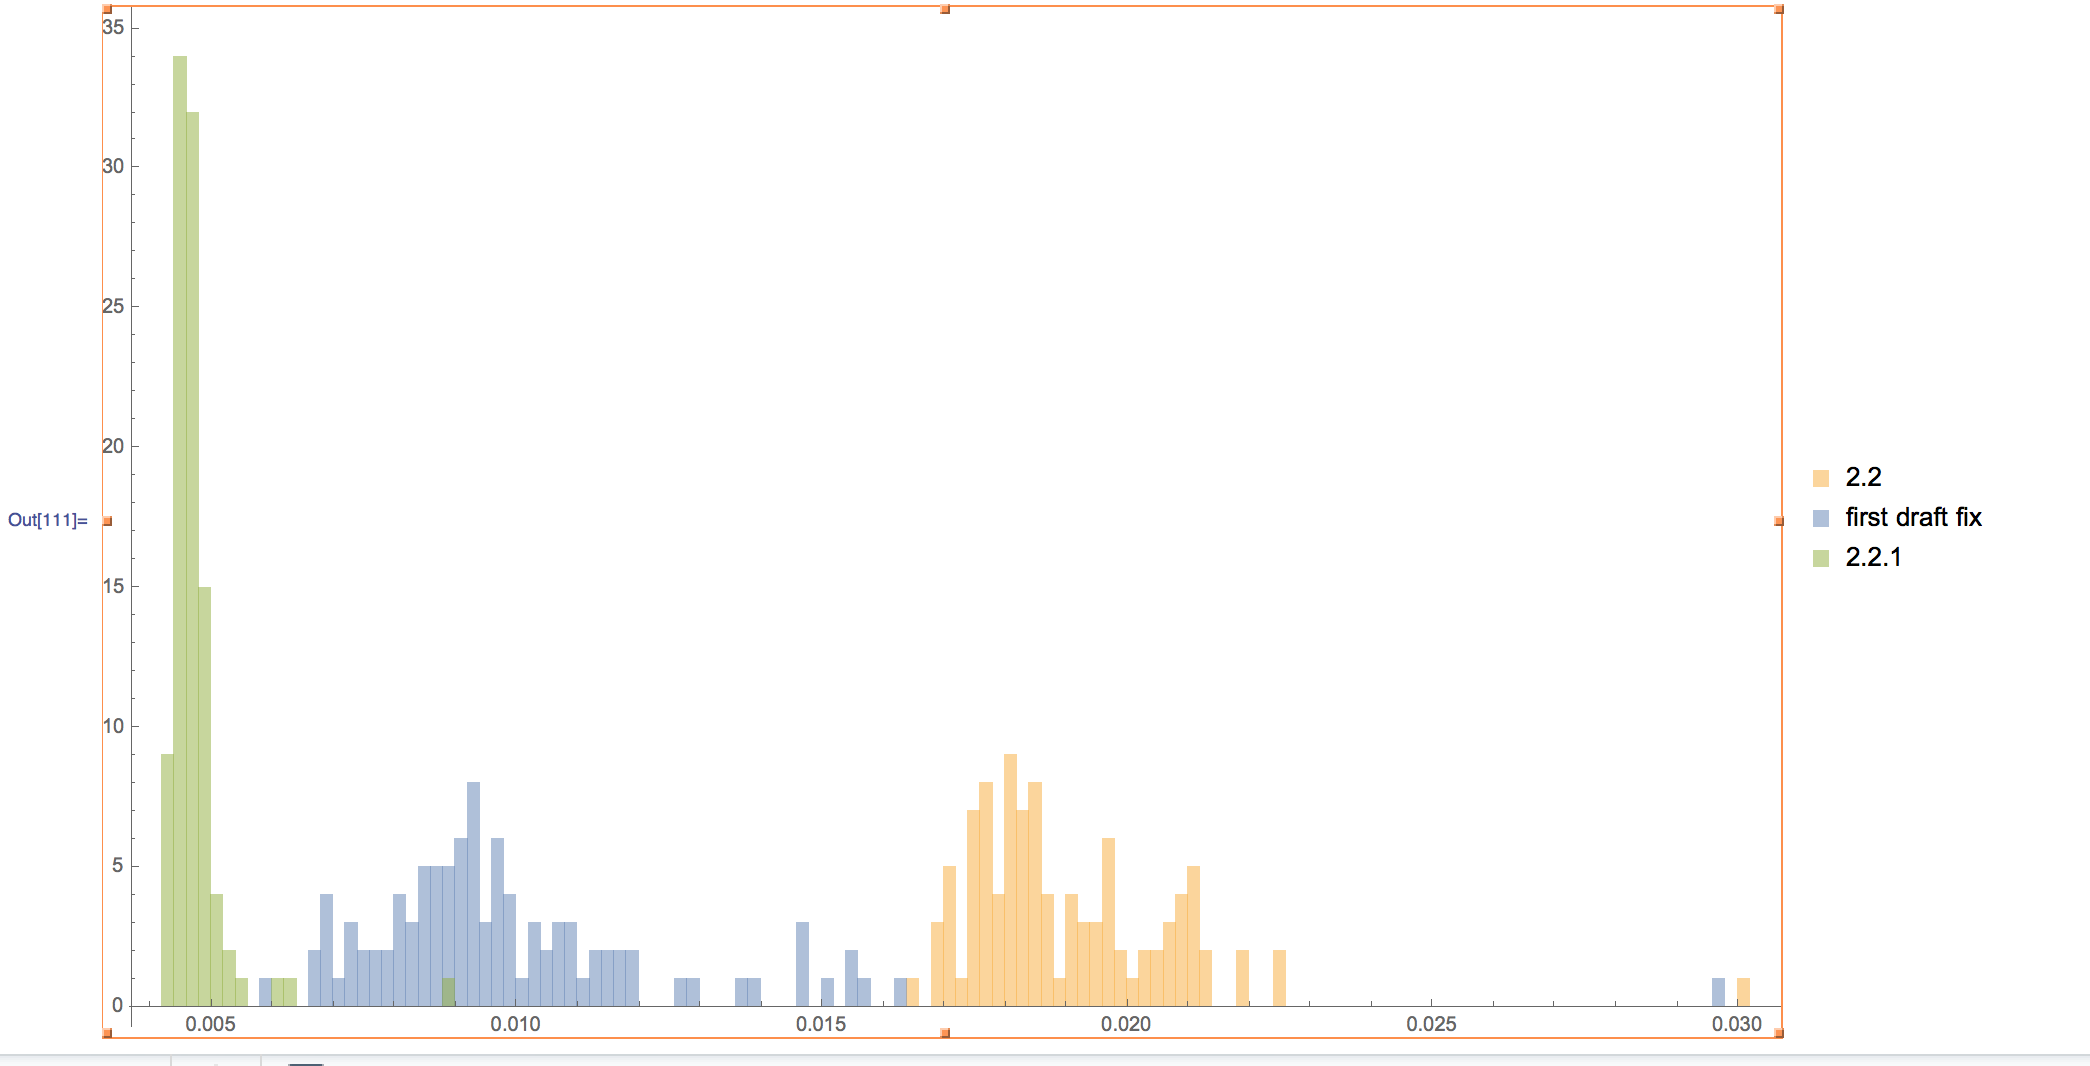
Not only is this benchmark now 4X faster, but we killed the variaton in the performance as well. We are now consistently 4X faster which – if you know a little arcana about networking – is a lot more interesting than the number itself.
For funsies we ran some actual statistical analysis on the 2.2 benchmark against the new 2.2.1 benchmark, and here are the results:
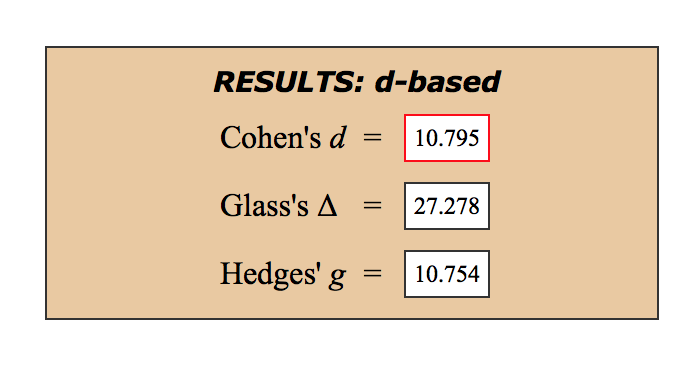
For those unfamiliar with how to interpret esoteric units like “Cohen’s d”, the “effect size” in English for these:
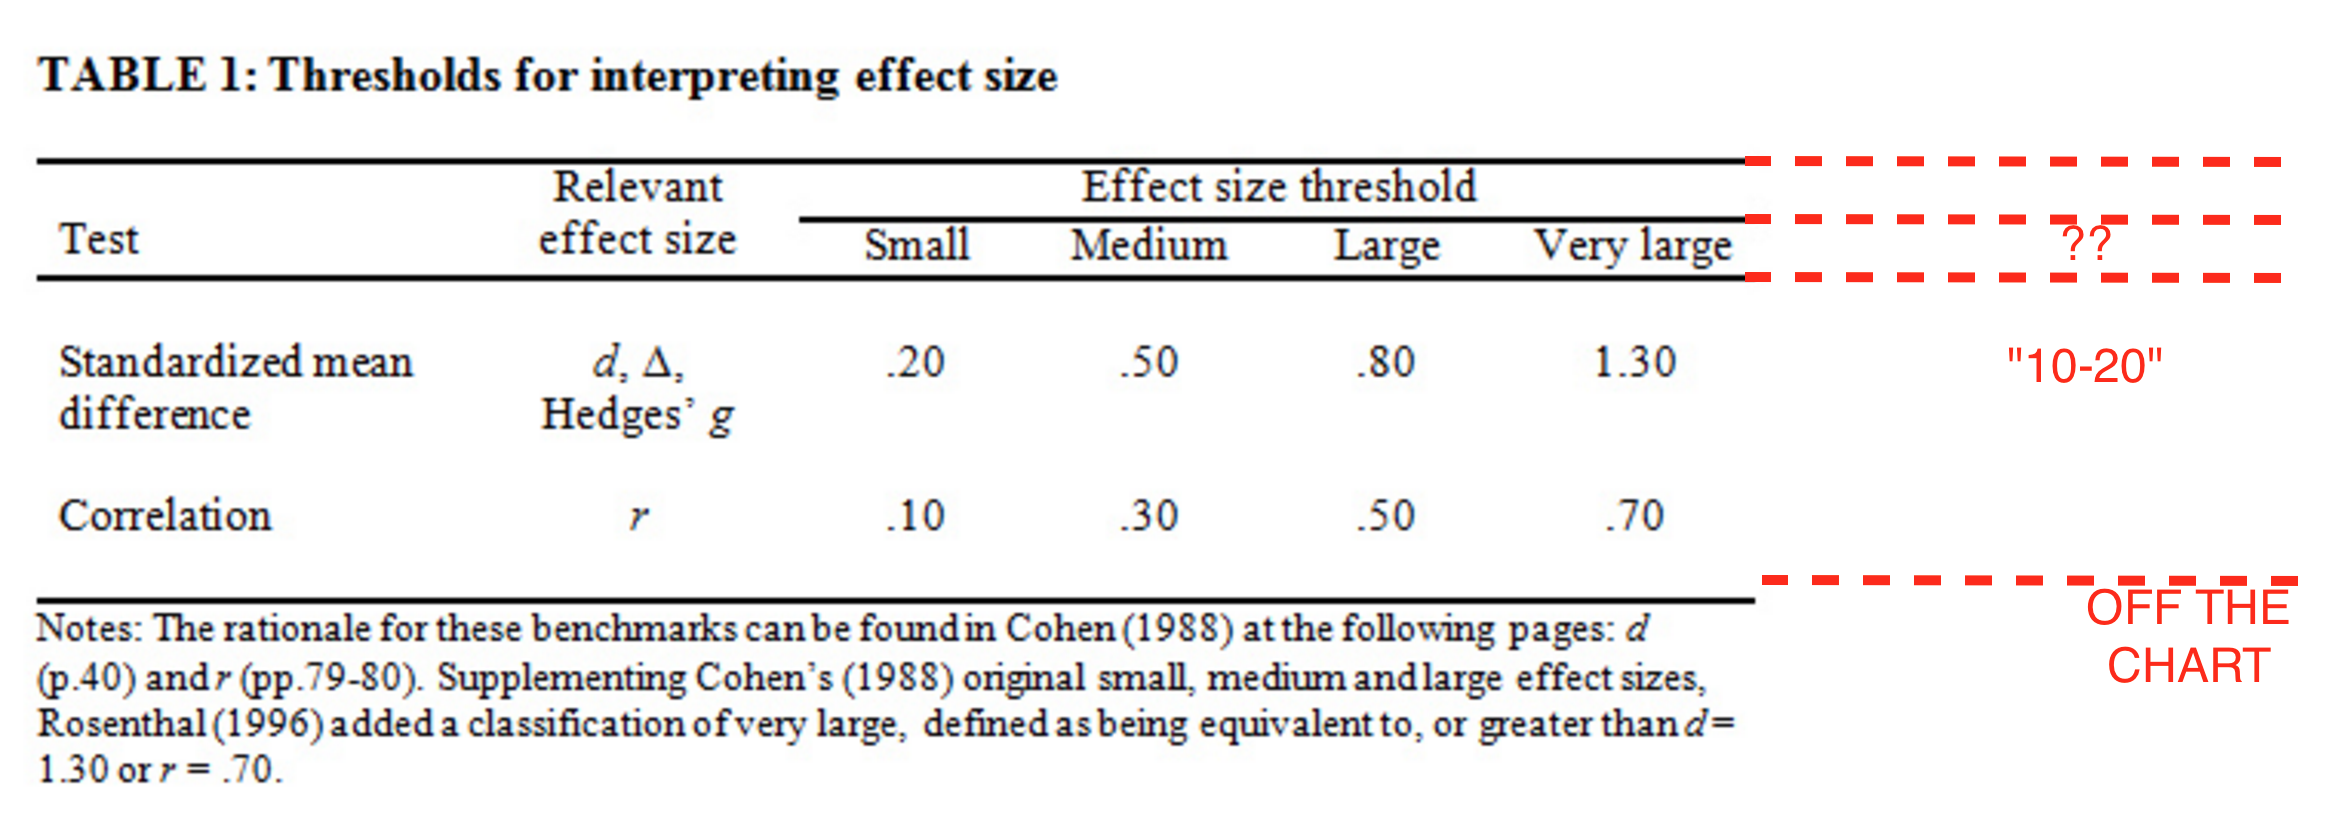
So this is the algorithm we’ve started shipping in 2.2.1. We strongly recommend updating!